
Our emissions targets
We’ve got greenhouse gas emission reduction targets to aim for.
Actions to lower emissions
We can all take a variety of everyday actions to live lower-emission lives.
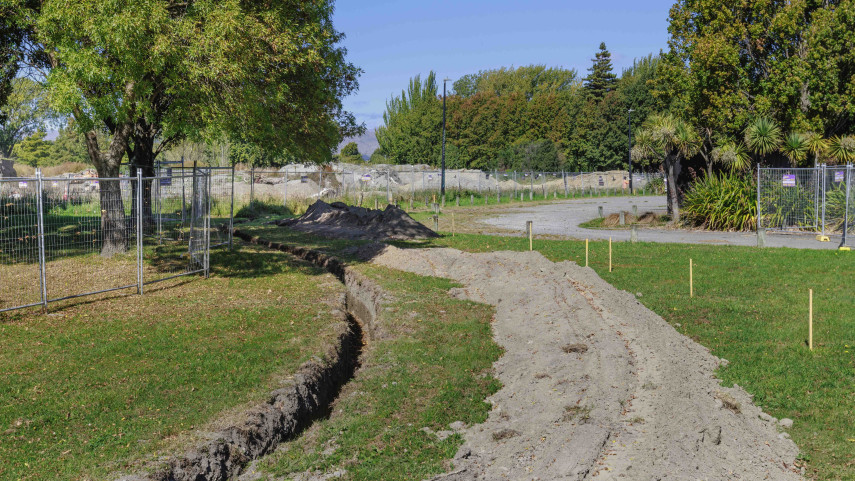
Ready your home for extreme weather
We've put together a range of tips to help you prepare your home for extreme weather.

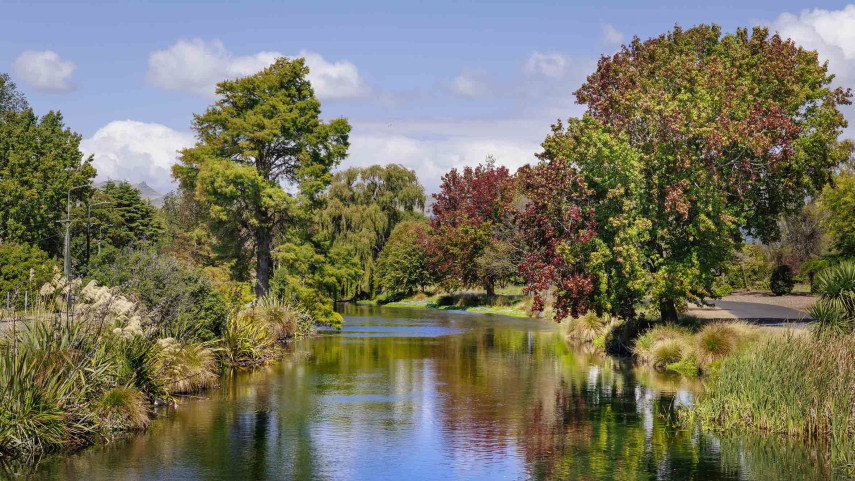
Our climate leadership
We’re committed to leading by example to meet our challenges.
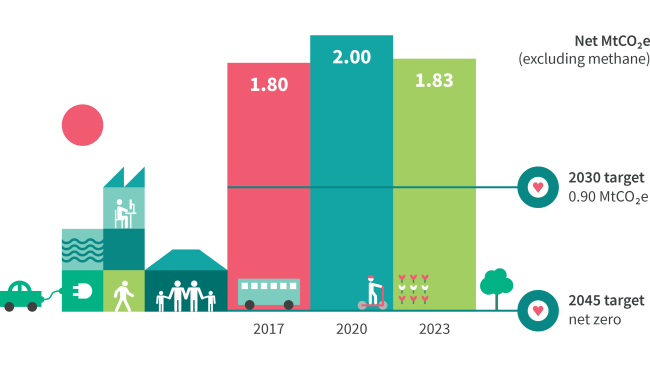
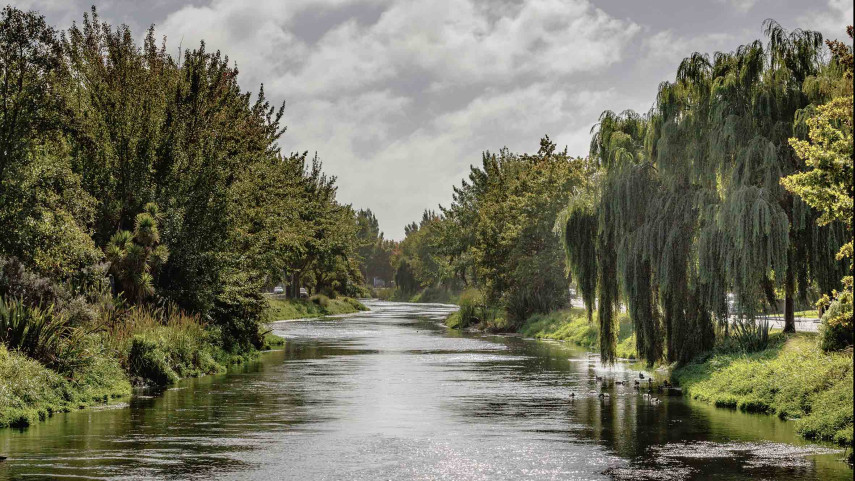
How we're tracking
We regularly measure the emissions generated by the Christchurch District and our Council operations. This helps us manage emissions and track our progress.
Our targets for Christchurch are to half emissions by 2030, compared with 2016 to 2017 levels, and to achieve net zero greenhouse gas emissions by 2045, with at least a 50% reduction in methane emissions by 2045.